Gaze and Physiological Response to Online Media
Tools used: Shimmer Sensor, Gazepoint Tracker, Attention Tool, Qualtrics, SPSS, R, Excel, PowerPoint, Adobe After Effects
Idea
This study I designed as a follow-up to "Shared Attention and Mass Media", linked above. I had personally wanted a more concrete, less abstract measure of people's attention. Their opinions were stronger after watching what they believed to be live (vs prerecorded) footage. I wanted to capture tangible measures that reflected the increased arousal level in order to help establish this was what was actually occurring. Watching something with others made it more exciting to be "in the moment" with them. We should be able to measure their excitement levels.
After some background research, I came to a few conclusions about what to expect.
Pupil Size
- Larger when something is emotionally charged (Partala et al., 2000)
- Larger with regard to general arousal levels/excitement (Marquart and de Winter, 2015)
- Larger with greater mental workload (Beatty, 1982)
Eye-tracking – Fixations - Lower amount of fixations with high excitement (Simola, Fevre, Torniainen, & Baccino, 2015)
- Increased eye movement with cognitive load (deep thinking/processing) (Ikehara & Crosby, 2004)
- Higher and more fluctuations with arousal levels/excitement (Wang et al., 2018)
Procedure
In order to achieve this I
implemented an eye-tracker designed to capture pupil size, the location
of people's gaze, along with the amount of eye movement (known as
"saccades" by people who fixate on that kind of thing). Participants were also to be attached to a heart-rate monitor to gauge fluctuations over time. For this experiment I reused the facsimile version of C-Span I had previously created, using only 2 conditions ~100 Live Viewers vs ~100 Previous Viewers.
This is the setup I used. I or a research assistant would welcome the participant, seat them in the cubicle to the right, and adjust the tracking equipment. The participant would then be given some brief instructions, such as not moving the chair or their bodies too much. After calibrating the eye-tracker the instructor would then leave and allow the experiment to run. A consistent ambient light level was maintained across participants.
Unfortunately about 15% of participants were disqualified due to issues with glasses or inability to remain still.
We first gave a brief survey with regard to the participant's current mood and political affiliation. The speech they were to watch involved a congresswoman passionately calling to reinstate the "Violence Against Women Act," a federal source of funding for shelters, legal funding, etc.
The participants were then shown a prompt which explained that we're helping C-Span test a new version of their website. Depending on the condition they were assigned, they would be shown the speech which was visibly labeled with ~100 live viewers or ~100 previous viewers.
As participants watched the speech I recorded the aforementioned measures. I also created specific AOIs (areas of interest), shown as shapes in the video to the left. This helped to capture the location of the participant's attention at a given moment.
Results
Pupil Size
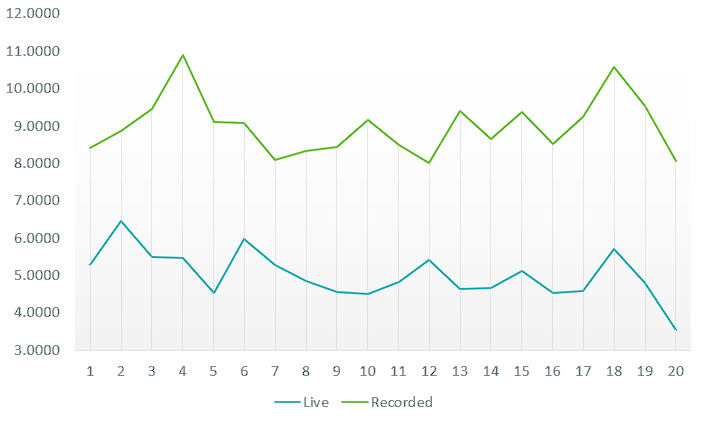
The X axis here represents the various steps of the experiment, 1-5 being introduction/instructions, the video labeled as such, and 7-12 being a post survey/debriefing. The Y axis is pupil diameter measured in millimeters.
Using 2-way Repeated Measures ANOVA, I found that participants in the "Live" condition did indeed have larger pupils while watching the video (F(1,63) = 5.64, p = .02). While the Live condition overall appeared to have marginally larger pupils, this was the only portion of the experiment approaching statistical significance. Additionally, the mean change in pupil size before/during the video was found to differ via t-test (t(73) = 2.89, p = .028).
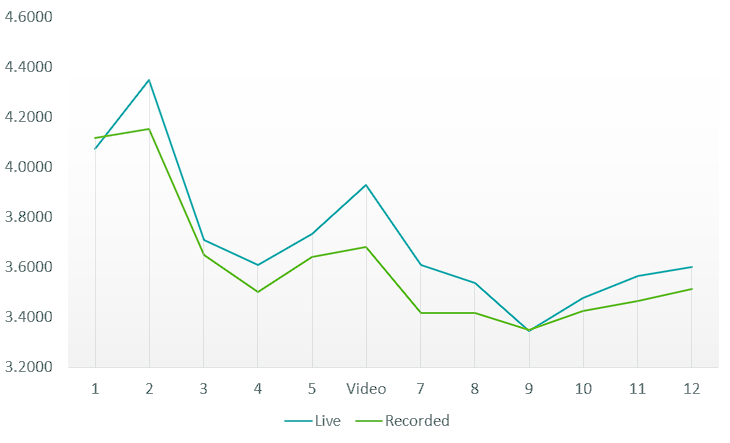
I found it interesting that while there are some observable patterns in pupil size change, the Live condition maintained a larger average diameter throughout.
Gaze Location
I had limited predictions for what to expect regarding where participants would be looking across conditions. My intuition was that people watching in the Live group may pay more attention to the amount of viewers, while those in the Recorded may wander more.
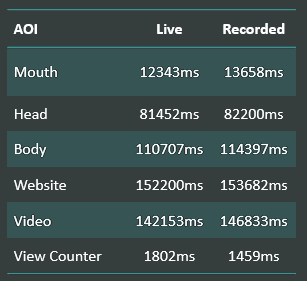
As it turned out, there were no differences for any particular location. People in the Live condition did seem to spend more time looking at the view counter, though not enough to be significant.
Fixations
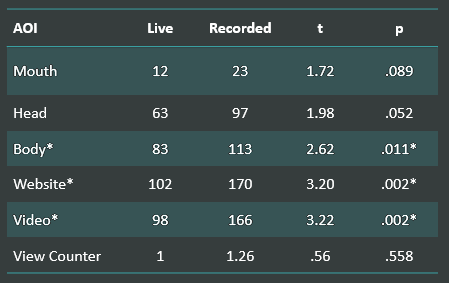
As predicted, there was an overall difference in the amount of fixations (gaze being still for 100ms). Those exposed the Live video fixated much less overall (t(73) = -3.20, p = .002). This was pretty exciting for me as it implied the same for the participants.
People didn't spend more time looking at any particular area, however they certainly fixated less. Locations with significant differences are marked with *.
The difference in the total amount of fixations during the video was quite large (t(70) = -3.59, p < .0001). The provided graph admittedly isn't entirely appropriate. The video portion of the experiment was much longer than the survey/intro slides and thus naturally disproportionate in size. At the same time it does work to highlight the marked difference between conditions, specifically during the video.
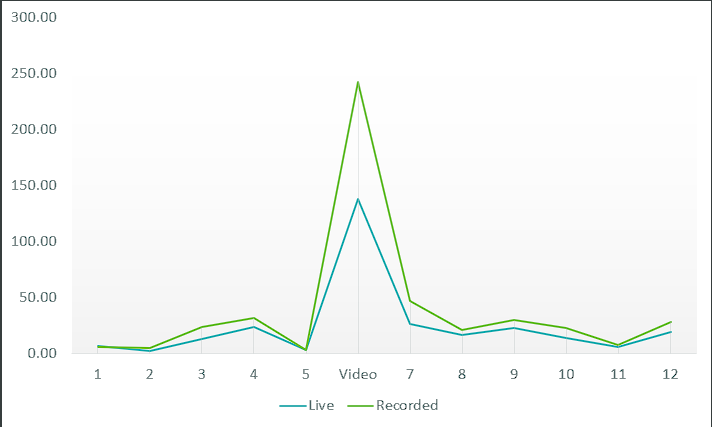
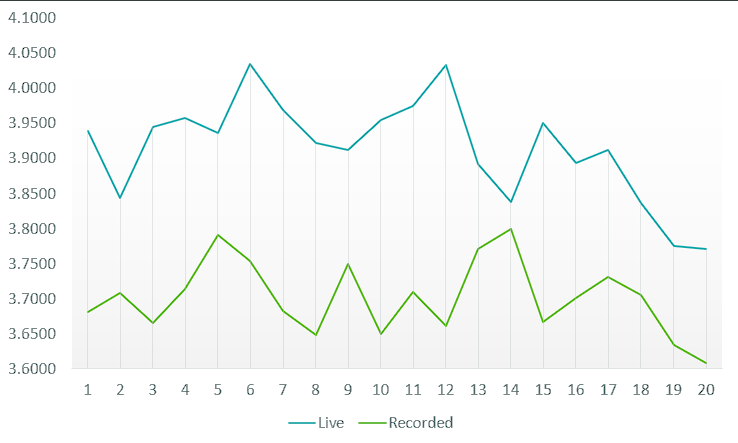
Similar to the above graph related to pupil size, you can clearly observe a difference in the amount of fixations during the speech. There is a general pattern across the duration of the speech between both groups. This was important to me because it implies a similar emotional experience across conditions at individual points of time, just more so for those watching Live. The participants believing it was live just intensified the experience of watching it all that much more.
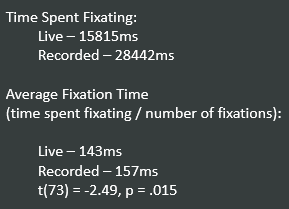
Not only did those in the Live group fixate less than those in the Recorded, they spent less time on average doing so. This is important because they weren't merely staring at a particular thing during the speech for longer. Overall, they spent less time doing so in general. They were darting their eyes more. This provided further evidence of elaboration as predicted above. They were both more excited to be watching and they were processing it on a deeper level.
Heart Rate

I initially had a somewhat difficult time with the output data from the heart rate sensor. It ran at a slightly different sample rate than the eye-tracker and did not provide the option to synchronize it directly. Rather than cutting trimming it to the speech itself as I had previously done, I decided to include it for the video's total duration. In this given chart, the speech itself starts at ~bin #5.
Again, from this point there was a marked observable difference, especially when the speech itself began.
Take Home
This study was a lot of fun for me. I got to use a lot of new tools and personally verify something that I'd previously only helped with.
I appreciate social psychology for what it is. It provides an excellent lens from which to categorize and predict behavior across large groups (which hopefully generalizes to some sort of human constant). At the same time, I've always felt it relied a bit too heavily on lofty abstract ideas. Social psychology is in the midst of a crisis. People in the field often rely heavily on hyper-contextual survey results. It's not surprising that things frequently fail to replicate.
This was my personal attempt to replicate something I'd previously been involved with. I wanted to use concrete, tangible, measures. You can lie on a survey. You can get bored and bubble things in randomly. You can easily be swayed by what the experimenter wants you to do, without them even knowing it themselves. You can't lie about your heart rate, your pupil size, or about what you're paying attention to when it's being tracked. It's a direct measure. It correlates to an abstraction, in this case "shared attention", but in a way it gives it more weight. It helps show what is genuinely going on when people are in the actual process of adopting stronger opinions.
The participants watched
what they assumed to be a live video feed and I captured a
physiological difference in their response to it. I like to think that adds some value and validity to the idea. This was a project that I was proud to have led.